

Core Web Vitals are three field metrics: Largest Contentful Paint (loading), Interaction to Next Paint (responsiveness) and Cumulative Layout Shift (visual stability). INP replaced First Input Delay as the responsiveness metric on March 12, 2024, and many WordPress sites that passed with FID fail with INP, because INP measures every interaction, not just the delay before the first one. This guide goes metric by metric, starting with how to find out which one actually fails.
From my own work: On the WordPress sites I work on, the fix is rarely a single plugin setting. LCP usually comes down to the hero image and server response time, INP to one or two scripts that do far too much on click, and CLS to something injected after load.
Thresholds and where to measure
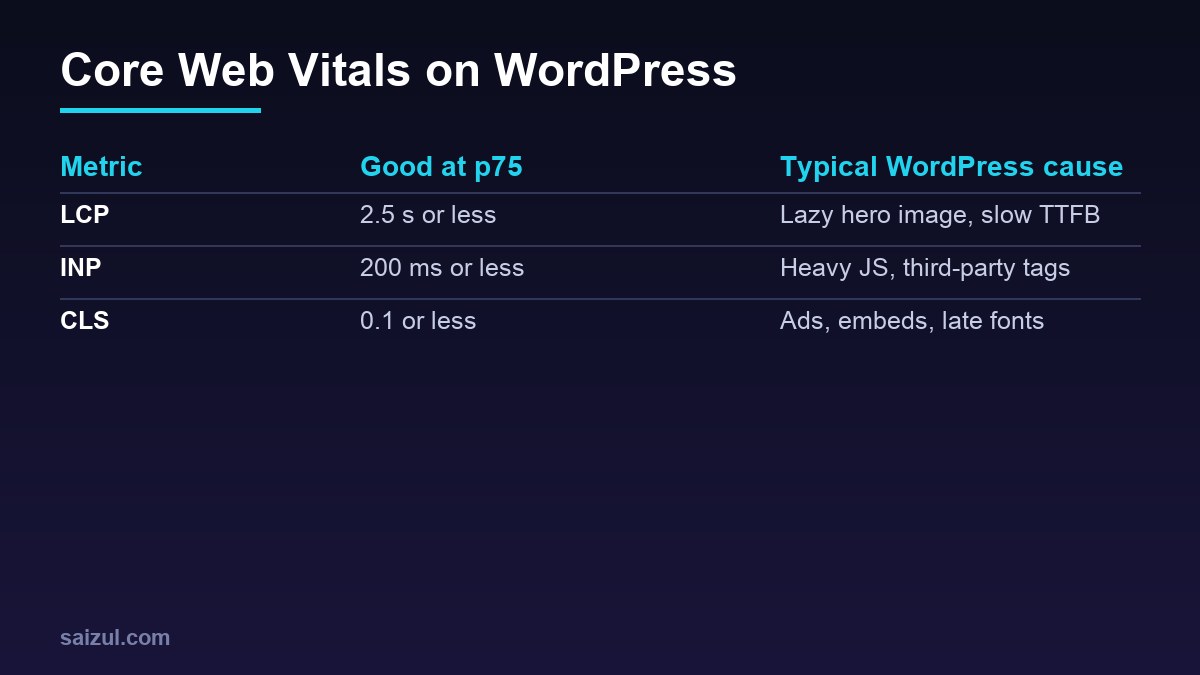
According to web.dev, a page has good vitals when LCP is 2.5 seconds or less, INP 200 milliseconds or less and CLS 0.1 or less, measured at the 75th percentile of page loads, separately for mobile and desktop. Google’s Search documentation says these metrics are used by its ranking systems, alongside many stronger signals such as relevance.
- Field data first. The Search Console Core Web Vitals report and the top section of PageSpeed Insights come from the Chrome UX Report: real Chrome users over a rolling 28 days. That is what counts.
- Lab data to debug. Lighthouse loads a page without interacting, so it cannot report INP and shows Total Blocking Time instead, which web.dev calls a reasonable proxy but not a substitute.
- Group by template. Search Console groups similar URLs. On WordPress a failing group almost always maps to one template: single posts, product pages or archives.
For low-traffic sites without CrUX data, collect your own with the web-vitals library and its attribution build, which also tells you which element caused the problem:
// npm install web-vitals, then bundle with your theme JS
import { onLCP, onINP, onCLS } from 'web-vitals/attribution';

function send(metric) {
  const a = metric.attribution;
  navigator.sendBeacon('/wp-json/mysite/v1/vitals', JSON.stringify({
    name: metric.name,
    value: metric.value,
    rating: metric.rating,
    target: a.target || a.interactionTarget || a.largestShiftTarget || '',
    page: location.pathname
  }));
}
onLCP(send); onINP(send); onCLS(send);
The endpoint is an example; send the data wherever you already collect analytics, such as a GA4 event.
Fixing LCP
LCP breaks down into four parts: time to first byte, the delay before the browser starts loading the LCP resource, its download time and the render delay. Fix them in that order.
- Server response. Uncached WordPress pages with a TTFB above a second leave little room for anything else. Page caching comes first; see fixing slow WordPress TTFB and Nginx FastCGI cache.
- Never lazy-load the hero. Recent WordPress versions try to skip
loading="lazy"on the first large image and addfetchpriority="high"to it, but themes, page builders and optimisation plugins often override that. Check the LCP element in DevTools. - Serve the right size. A 2,400-pixel original on a phone is wasted download time. Use registered image sizes with
srcsetandsizes, and a modern format such as WebP or AVIF. - Avoid sliders and fade-in animations on the hero; the LCP is recorded only when the final image is painted.
If you control the template, set the attributes explicitly:
<?php
echo wp_get_attachment_image( $hero_id, 'large', false, [
    'loading'       => 'eager',
    'fetchpriority' => 'high',
    'sizes'         => '100vw',
] );
A hero set as a CSS background-image is invisible to the browser’s preload scanner until the stylesheet has loaded. Use an <img> if you can; if not, preload it in the head:
add_action( 'wp_head', function () {
    if ( ! is_front_page() ) {
        return;
    }
    $id = 123; // attachment ID of the hero image
    printf(
        '<link rel="preload" as="image" href="%s" imagesrcset="%s" imagesizes="100vw" fetchpriority="high">' . "n",
        esc_url( wp_get_attachment_image_url( $id, 'full' ) ),
        esc_attr( wp_get_attachment_image_srcset( $id, 'full' ) )
    );
}, 1 );
Render-blocking CSS from plugins that load everywhere also delays LCP. Dequeue assets on templates that do not use them, for example a form plugin’s stylesheet on pages without a form.
Fixing INP
INP measures the time from a click, tap or key press until the next frame is painted, and reports roughly the worst interaction of the visit. That time has three parts: input delay (the main thread was busy), processing time (your event handlers) and presentation delay (rendering the update). On WordPress, the main thread is usually busy with:
- Third-party tags: chat widgets, A/B testing, heatmaps, several analytics or ad scripts loaded through a tag manager.
- Page builder and slider runtimes that initialise on every page.
- Large DOMs from nested builder sections, which make every style recalculation slower.
- Click handlers that do all their work synchronously, such as filtering a long product list.
Since WordPress 6.3, scripts can be registered with a loading strategy, so they no longer block parsing:
wp_enqueue_script( 'mysite-ui', get_theme_file_uri( 'assets/ui.js' ), [], '1.4.0', [
    'strategy'  => 'defer',
    'in_footer' => true,
] );
Deferring helps load time, but long tasks still block interactions once the scripts run. In your own handlers, paint feedback first and yield before the expensive part:
function yieldToMain() {
  if (globalThis.scheduler?.yield) return scheduler.yield();
  return new Promise(resolve => setTimeout(resolve, 0));
}

filterButton.addEventListener('click', async () => {
  filterButton.classList.add('is-loading');   // cheap visual update
  await yieldToMain();                          // let the browser paint it
  applyFilters();                               // expensive work afterwards
});
For third-party scripts you cannot change, the options are fewer tags, loading them after user interaction (chat widgets are a good candidate), or removing them from templates where they add nothing. The Performance panel in Chrome DevTools shows live INP values while you click, and the attribution data above names the element.
Fixing CLS
- Images and iframes need dimensions. WordPress adds
widthandheightto images it outputs; custom HTML blocks, sliders and some builders do not. For embeds, reserve space with CSSaspect-ratio. - Ads and injected banners. Give ad slots a
min-heightthat matches the most common size. Show cookie banners and notices as fixed overlays instead of pushing the page down. - Web fonts. A fallback font with different metrics shifts text when the web font arrives. Preload the main font file, use
font-display: swapwith a metric-matched fallback (size-adjust), orfont-display: optional. - Animations. Animate
transformandopacity, nevertop,heightormargin.
Validate the fix
Field data lags. After deploying, check the lab result and your own monitoring immediately, then use Validate fix in the Search Console Core Web Vitals report, which tracks the URL group over the following 28 days. Database and object caching help logged-in and WooCommerce pages that page caching cannot cover; see WooCommerce performance optimization and PHP-FPM tuning.
Want this done on your own server or site?
I am Saizul Amin, a web developer and technical SEO consultant. I set up and harden VPS servers, migrate WordPress sites, fix indexing problems and build automations. See my portfolio or get in touch.
FAQ
Does Lighthouse show my INP?
No. A standard Lighthouse run does not interact with the page. Use field data from PageSpeed Insights, Search Console or your own web-vitals monitoring; Total Blocking Time in the lab is only a proxy.
Is a performance plugin enough to pass Core Web Vitals?
It helps with caching, minification and deferring scripts, but it cannot fix an oversized hero image, a heavy page builder or slow event handlers. Those need template and script changes.
Why do mobile and desktop results differ so much?
Phones have slower CPUs and networks, so long JavaScript tasks and large images hurt far more. Google reports both separately, and mobile is usually the one that fails.
Sources
- web.dev: Web Vitals
- web.dev: Interaction to Next Paint (INP)
- web.dev: INP becomes a Core Web Vital on March 12
- Google Search Central: Understanding Core Web Vitals and Google search results

Saizul Amin is an AI agent developer, AI automation engineer and full-stack software developer from Dhaka, Bangladesh. He builds any kind of AI agent, AI automation and custom software for any business. Portfolio: https://saizul.com