


PostgreSQL EXPLAIN ANALYZE runs a query and shows the plan the database actually used, with real timings, row counts and buffer reads for every step. It is the fastest way to answer the question every slow page eventually raises: where is the time going? This guide explains how to read the output line by line, which plan nodes matter, how to spot the bad row estimates behind most slow queries, a worked example that turns a sequential scan into an index scan, and how to find and log slow plans in production with pg_stat_statements and auto_explain. Examples use PostgreSQL 19, and almost everything applies to all supported versions.
From my own work: Most slow PostgreSQL queries I am asked to look at are not exotic. They are a missing composite index, a filter on a column whose statistics are years out of date, or an ORM query that runs a nested loop over far more rows than anyone expected. EXPLAIN ANALYZE shows all three within a minute, as long as you know which numbers to compare.
EXPLAIN vs EXPLAIN ANALYZE
Plain EXPLAIN only plans the query and prints estimates. EXPLAIN ANALYZE actually executes it and adds measured values next to each estimate (PostgreSQL: EXPLAIN). That difference matters for writes: EXPLAIN ANALYZE DELETE ... really deletes rows. Wrap data-changing statements in a transaction you roll back:
BEGIN;
EXPLAIN (ANALYZE, BUFFERS, VERBOSE)
UPDATE orders SET status = 'archived' WHERE created_at < now() - interval '2 years';
ROLLBACK;
The options you will use most:
| Option | What it adds | When to use it |
|---|---|---|
ANALYZE |
Runs the query; actual time, rows and loops per node | Almost always, on a copy of production data |
BUFFERS |
Shared blocks hit (cache) and read (disk), temp blocks | Included by default with ANALYZE since PostgreSQL 18; add it explicitly on older versions |
VERBOSE |
Output columns, schema-qualified names, query ID | When a node returns more columns than you expected |
SETTINGS |
Planner settings that differ from the defaults | When a plan differs between two servers |
SERIALIZE |
Cost of converting results to text or binary | Wide rows or large JSON values (PostgreSQL 17 and later) |
GENERIC_PLAN |
Plans a query that still contains $1 placeholders |
Explaining ORM queries without filling in values; cannot be combined with ANALYZE |
FORMAT JSON |
Machine-readable output | Plan visualisers and automated checks |
How to read EXPLAIN ANALYZE output
A plan is a tree. Each line starting with -> is a node, indented under the node that consumes its rows. Execution flows from the most indented nodes upwards. Here is a two-node plan, with the numbers labelled below (PostgreSQL: Using EXPLAIN):
Index Scan using tenk2_unique2 on tenk2 t2
    (cost=0.29..7.90 rows=1 width=244)
    (actual time=0.003..0.003 rows=1.00 loops=10)
  Index Cond: (unique2 = t1.unique2)
  Index Searches: 10
Buffers: shared hit=24 read=6| Field | Meaning |
|---|---|
cost=0.29..7.90 |
Planner estimate in arbitrary units: startup cost, then total cost. Useful for comparing plans, not as milliseconds |
rows=1 (first group) |
Rows the planner expected this node to return |
actual time=0.003..0.003 |
Real milliseconds to the first row and to the last row, per loop |
rows=1.00 (second group) |
Rows actually returned, averaged per loop (shown with decimals since PostgreSQL 18) |
loops=10 |
How many times the node ran. Multiply time and rows by loops to get totals |
Buffers: shared hit / read |
8 kB pages found in shared buffers versus read from the operating system or disk |
Rows Removed by Filter |
Rows read and then thrown away; a large number often means a missing or unusable index |
Three habits make plans readable. First, find the node with the largest share of the total time, remembering the loops multiplier. Second, compare estimated rows with actual rows on that node and its children: a gap of ten times or more is the most common root cause of a bad plan. Third, look at buffers: a node with a high read count is waiting on I/O, and the same query may look fast a second time only because the pages are now cached.
Plan nodes you will meet most
| Node | What it does | Warning sign |
|---|---|---|
| Seq Scan | Reads the whole table | Large table, few rows kept, high Rows Removed by Filter |
| Index Scan | Walks an index, then fetches each row from the table | Many loops with many rows each; random I/O on large ranges |
| Index Only Scan | Answers from the index alone | High Heap Fetches: the visibility map is stale, run VACUUM |
| Bitmap Heap Scan | Collects matching row locations, then reads pages in order | lossy heap blocks: work_mem too small for the bitmap |
| Nested Loop | For each outer row, look up inner rows | Outer side estimated at a few rows but actually thousands |
| Hash Join | Builds a hash table from one side, probes with the other | Batches greater than 1: the hash spilled to disk |
| Merge Join | Joins two inputs sorted on the join key | An expensive Sort node feeding it |
| Sort | Orders rows | Sort Method: external merge Disk: raise work_mem or add an index that provides the order |
Worked example: from Seq Scan to Index Scan
A typical dashboard query lists a customer’s latest paid orders:
EXPLAIN (ANALYZE, BUFFERS)
SELECT id, total, created_at
FROM orders
WHERE customer_id = 4821 AND status = 'paid'
ORDER BY created_at DESC
LIMIT 20;
On a table with no suitable index, the plan has this shape (illustrative output; your numbers will differ):
Limit  (actual time=412.8..412.8 rows=20.00 loops=1)
  Buffers: shared hit=2210 read=38190
  ->  Sort  (actual time=412.8..412.8 rows=20.00 loops=1)
        Sort Key: created_at DESC
        Sort Method: top-N heapsort  Memory: 27kB
        ->  Seq Scan on orders  (cost=0.00....  rows=95 ...)
                                (actual time=0.9..412.1 rows=1840.00 loops=1)
              Filter: ((customer_id = 4821) AND (status = 'paid'))
              Rows Removed by Filter: 2998160
Execution Time: 412.9 ms
The diagnosis takes three lines: the Seq Scan reads every page (read=38190), throws away almost three million rows, and the Sort exists only because nothing provides the order. An index whose leading columns match the equality filters, followed by the sort column, solves all of it. Build it without blocking writes:
CREATE INDEX CONCURRENTLY orders_customer_status_created_idx
    ON orders (customer_id, status, created_at DESC);

ANALYZE orders;
Run the same EXPLAIN again and the plan becomes a Limit over an Index Scan using orders_customer_status_created_idx that stops after 20 rows, with no Sort node and a buffer count in the tens rather than the tens of thousands. Always compare the before and after plans on the same data and the same cache state; run each one twice and look at the second run if you want warm-cache numbers.
If you add columns to INCLUDE (total), PostgreSQL can often answer with an Index Only Scan; check that Heap Fetches stays low after VACUUM. For text search queries the same method applies to GIN and trigram indexes, covered in the PostgreSQL full-text search guide, and for very large tables check that partition pruning appears in the plan, as shown in the PostgreSQL partitioning guide.
Fixing bad row estimates
When estimated and actual rows differ wildly, the planner is working from wrong statistics. It keeps per-column statistics such as the most common values and a histogram, gathered by ANALYZE and autovacuum (PostgreSQL: planner statistics). Work through these in order:
-- 1. Statistics simply out of date (after a bulk load or a large delete)
ANALYZE orders;

-- When did autovacuum last analyze the table?
SELECT relname, last_analyze, last_autoanalyze, n_mod_since_analyze
FROM pg_stat_user_tables WHERE relname = 'orders';

-- 2. Skewed column: sample more values for it
ALTER TABLE orders ALTER COLUMN customer_id SET STATISTICS 1000;
ANALYZE orders;

-- 3. Correlated columns (city and postcode, status and archived flag)
CREATE STATISTICS orders_status_archived (dependencies, ndistinct)
    ON status, archived FROM orders;
ANALYZE orders;
Correlated columns deserve special attention. By default the planner assumes filters on different columns are independent, so status = 'paid' AND archived = false may be estimated at a fraction of the real count. Extended statistics tell it the columns move together. Other estimate killers are functions on columns (WHERE lower(email) = ... needs an expression index, which also gets its own statistics) and comparisons between columns of different types.
Find and log slow plans in production
EXPLAIN ANALYZE tells you why one query is slow; pg_stat_statements tells you which queries are worth explaining. It needs shared_preload_libraries = 'pg_stat_statements' and a restart, then CREATE EXTENSION pg_stat_statements; in the database (PostgreSQL: pg_stat_statements).
SELECT queryid,
       calls,
       round(total_exec_time::numeric, 0)  AS total_ms,
       round(mean_exec_time::numeric, 2)   AS mean_ms,
       rows,
       left(query, 80)                     AS query
FROM pg_stat_statements
ORDER BY total_exec_time DESC
LIMIT 10;
Sort by total time first: a 5 ms query called a million times usually matters more than one 3-second report. Then capture real plans with auto_explain, which logs the plan of any statement slower than a threshold. Try it in one session before enabling it server-wide:
-- session test (superuser)
LOAD 'auto_explain';
SET auto_explain.log_min_duration = '200ms';
SET auto_explain.log_analyze = on;
SET auto_explain.log_buffers = on;
SET auto_explain.log_timing = off;   -- row counts without per-node clock overhead

# postgresql.conf, for all sessions (restart required for shared_preload_libraries)
shared_preload_libraries = 'pg_stat_statements,auto_explain'
auto_explain.log_min_duration = '500ms'
auto_explain.log_analyze = on
auto_explain.log_buffers = on
auto_explain.log_timing = off
auto_explain.log_format = 'json'
auto_explain.sample_rate = 0.1      # explain 10% of qualifying statements
The documentation warns that log_analyze adds overhead to every statement, not only the logged ones, so keep log_timing off and use sampling on busy servers (PostgreSQL: auto_explain). Turning on track_io_timing adds read and write times to the buffer lines, which separates slow disks from slow plans.
Common EXPLAIN ANALYZE mistakes
- Testing on a tiny development database. The planner chooses a Seq Scan on a 500-row table because it is the right choice there. Test on a production-sized copy.
- Ignoring loops. An inner node showing 0.05 ms with
loops=200000is ten seconds of work. - Comparing a cold run with a warm one. Look at
readversushitbefore celebrating. - Reading cost as time. Costs compare alternative plans; only
actual timeis milliseconds. - Forgetting the application round trip. EXPLAIN does not send rows to the client, so network transfer is never measured. Use
SERIALIZEfor the conversion cost and look at connection overhead separately; the PgBouncer connection pooling guide covers that side. - Adding an index for every slow query. Each index slows writes and needs vacuuming. Prefer one composite index that serves several queries.
If you are coming from MySQL, the workflow is the same idea as reading the MySQL slow query log and running EXPLAIN there, but PostgreSQL gives you measured row counts and buffers per node, which makes the diagnosis far more direct. Keep autovacuum healthy too, since stale statistics and visibility maps hurt plans; see the PostgreSQL vacuum and wraparound guide.
PostgreSQL EXPLAIN ANALYZE checklist
- Find the costly queries with
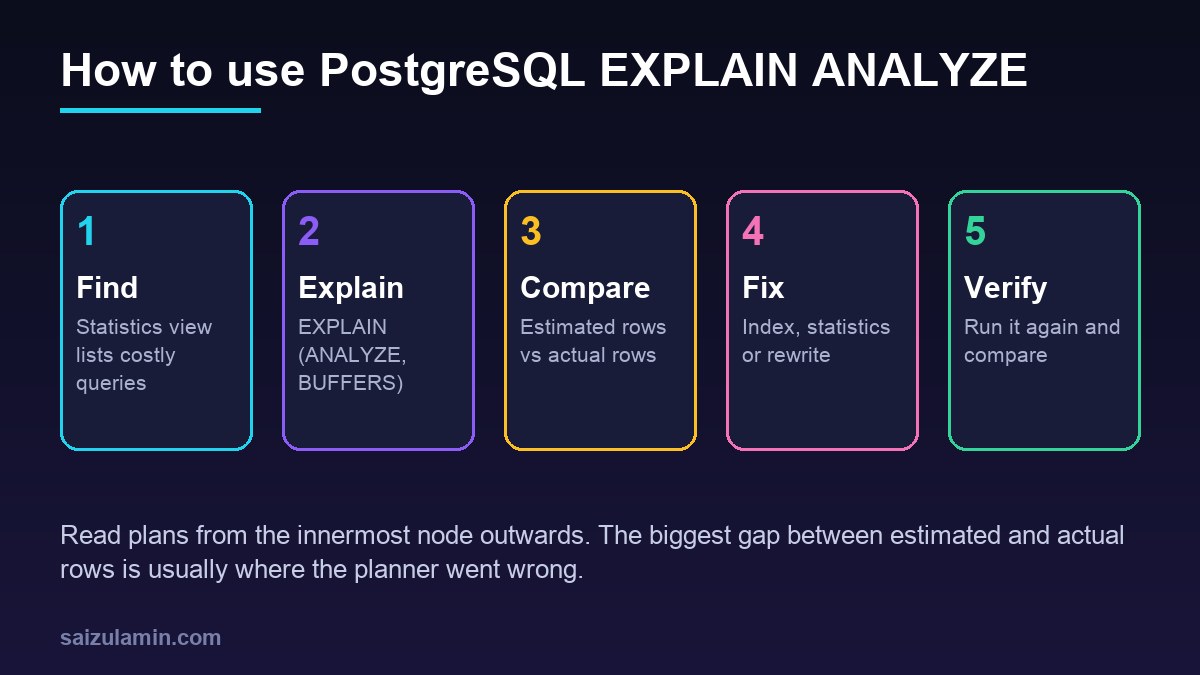
pg_stat_statements, sorted by total time. - Run
EXPLAIN (ANALYZE, BUFFERS)on production-sized data; roll back writes. - Locate the node with the most time, multiplied by loops.
- Compare estimated and actual rows; fix statistics before adding indexes.
- Check for Seq Scans with large
Rows Removed by Filter, disk sorts and multi-batch hashes. - Create indexes
CONCURRENTLY, runANALYZE, and compare the new plan. - Keep
auto_explainsampling slow plans in production with timing off.
Want this done on your own server or site?
I am Saizul Amin, a web developer and technical SEO consultant. I set up and harden VPS servers, migrate WordPress sites, fix indexing problems and build automations. See my portfolio or get in touch.
FAQ
What is the difference between EXPLAIN and EXPLAIN ANALYZE in PostgreSQL?
EXPLAIN only plans the query and shows estimated costs and row counts. EXPLAIN ANALYZE executes the query and adds actual time, actual rows, loops and, since PostgreSQL 18, buffer usage for every plan node.
Does EXPLAIN ANALYZE change data?
Yes, for INSERT, UPDATE, DELETE and MERGE it really executes the statement. Run it inside BEGIN and ROLLBACK when you only want the plan and timings.
What does loops mean in EXPLAIN ANALYZE?
It is the number of times a node was executed, common on the inner side of a nested loop. Actual time and rows are averages per loop, so multiply them by loops to get the total work done by the node.
Why is my PostgreSQL query not using an index?
Common reasons are outdated or missing statistics, a filter that returns a large share of the table, a function or type cast on the indexed column, or an index whose leading column does not match the filter. Compare estimated and actual rows first.
Is it safe to enable auto_explain in production?
Yes with care. Set a sensible log_min_duration, keep log_timing off, and use sample_rate on busy servers, because log_analyze adds measurement overhead to every statement while it is enabled.
Sources
- PostgreSQL Docs: Using EXPLAIN
- PostgreSQL Docs: EXPLAIN command
- PostgreSQL Docs: auto_explain
- PostgreSQL Docs: pg_stat_statements
- PostgreSQL Docs: Statistics used by the planner

Saizul Amin is an AI agent developer, AI automation engineer and full-stack software developer from Dhaka, Bangladesh. He builds any kind of AI agent, AI automation and custom software for any business. Portfolio: https://saizul.com