

Lighthouse CI runs Lighthouse on every pull request, checks the results against budgets you set, and keeps the full JSON reports so you can see exactly what changed. The HTML report is for people; the JSON report is for automation, and once you know where the scores, metrics and failing audits live in it, you can build any check or summary you need. This guide covers the structure of the Lighthouse JSON report, jq queries you can run today, a lighthouserc.json with assertions, a Node script that summarises the median runs, and a GitHub Actions workflow that writes a job summary and comments on the pull request.
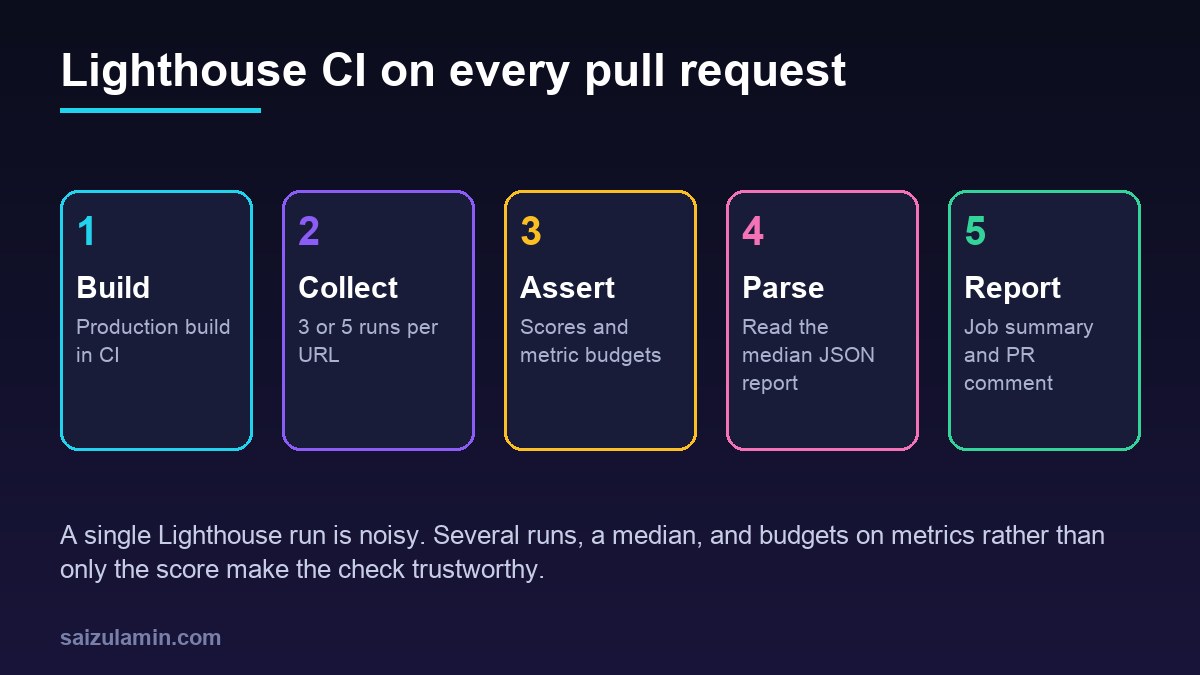
From my own work: When I add Lighthouse to a client pipeline, the first week is mostly about noise, not performance. A single run on a shared CI runner swings enough to fail a pull request that changed only a README. Three runs, the median, and budgets on Total Blocking Time and Largest Contentful Paint instead of only the overall score made the check something developers trusted rather than retried.
What is inside a Lighthouse JSON report
The JSON output is the Lighthouse result object, often called the LHR. Every report, whether from the CLI, Lighthouse CI or PageSpeed Insights, uses the same structure (Lighthouse: understanding the results). The paths you will use most:
| Path | What it holds |
|---|---|
lighthouseVersion |
Lighthouse version that produced the report; compare reports only across the same version |
requestedUrl, finalDisplayedUrl |
The URL you asked for and the one shown after redirects |
runWarnings, runtimeError |
Problems during the run; a report with a runtime error is not a real measurement |
configSettings.formFactor |
mobile or desktop |
categories.<id>.score |
Category score from 0 to 1 for performance, accessibility, best-practices and seo |
categories.<id>.auditRefs |
The audits in the category, with their weights |
audits.<id>.score |
Audit score from 0 to 1, or null for informative audits |
audits.<id>.numericValue |
Raw metric value, in milliseconds for timing metrics and unitless for CLS |
audits.<id>.scoreDisplayMode |
How to read the score, such as numeric, binary, informative or notApplicable |
audits.<id>.details |
Tables and lists of the offending resources or elements |
Category scores in the JSON are 0 to 1; the 0 to 100 numbers in the HTML report are the same values multiplied by 100.
Step 1: produce a JSON report from the CLI
You can explore the format before setting up any CI. Lighthouse needs Node and Chrome:
# mobile run (the default), performance only, JSON out
npx lighthouse@13 https://example.com
  --only-categories=performance
  --output=json --output-path=./report.json
  --chrome-flags="--headless=new" --quiet

# desktop run with all categories, both HTML and JSON
npx lighthouse@13 https://example.com --preset=desktop
  --output=json --output=html --output-path=./desktop
  --chrome-flags="--headless=new" --quiet
Step 2: read scores, metrics and failing audits with jq
# category scores as 0-100
jq -r '.categories | to_entries[] | "(.key)t(.value.score * 100 | round)"' report.json

# key lab metrics with their raw values
jq -r '.audits | to_entries[]
  | select(.key | IN("first-contentful-paint","largest-contentful-paint",
                     "total-blocking-time","cumulative-layout-shift","speed-index"))
  | "(.key)t(.value.numericValue | . * 1000 | round / 1000)t(.value.displayValue)"' report.json

# audits that failed (score below 0.9), excluding informative ones
jq -r '.audits[] | select(.score != null and .score < 0.9
       and (.scoreDisplayMode == "numeric" or .scoreDisplayMode == "binary"))
       | "(.score)t(.id)t(.title)"' report.json | sort -n

# was the run healthy?
jq '{version: .lighthouseVersion, url: .finalDisplayedUrl,
     error: .runtimeError.code, warnings: .runWarnings}' report.json
The performance score is a weighted blend of metric scores, and each metric score comes from a log-normal curve based on real-world data, so a small change in a metric near the curve’s steep part can move the score a lot (Chrome: Lighthouse performance scoring). That is why budgets on numericValue are easier to reason about than a score threshold alone.
Step 3: configure Lighthouse CI with assertions
Lighthouse CI wraps the same engine with three steps: collect runs Lighthouse several times, assert checks results against your rules, and upload stores reports. Assertions use an eslint-style format of level and options, keyed by audit ID or by categories:<id>; without options an assertion uses minScore: 1 with the optimistic aggregation method (Lighthouse CI configuration).
{
  "ci": {
    "collect": {
      "staticDistDir": "./dist",
      "url": ["http://localhost/", "http://localhost/blog/", "http://localhost/pricing/"],
      "numberOfRuns": 3,
      "settings": { "preset": "desktop" }
    },
    "assert": {
      "assertions": {
        "categories:performance":   ["error", { "minScore": 0.9, "aggregationMethod": "median-run" }],
        "categories:accessibility": ["error", { "minScore": 0.95 }],
        "categories:seo":           ["warn",  { "minScore": 0.95 }],
        "largest-contentful-paint": ["error", { "maxNumericValue": 2500, "aggregationMethod": "median-run" }],
        "total-blocking-time":      ["error", { "maxNumericValue": 200,  "aggregationMethod": "median-run" }],
        "cumulative-layout-shift":  ["error", { "maxNumericValue": 0.1,  "aggregationMethod": "median-run" }]
      }
    },
    "upload": {
      "target": "filesystem",
      "outputDir": "./lhci"
    }
  }
}
A few notes on these choices:
staticDistDirserves a static build with Lighthouse CI’s built-in server. For apps that need their own server, usestartServerCommandinstead, and never point CI at production for pull request checks.median-runjudges the representative run instead of the best one, which is stricter and more honest than the default optimistic method.- Budgets on metrics catch the change that matters: an extra 300 ms of blocking time fails the check even if the score rounding hides it. The good thresholds for LCP and CLS match the ones in the Core Web Vitals guide; Total Blocking Time is the lab stand-in for INP.
filesystemupload writes every report plus amanifest.jsonto./lhci, which the next step reads.
Step 4: summarise the median runs from manifest.json
With the filesystem target, manifest.json lists each report with its URL, its JSON path, an isRepresentativeRun flag for the median run and a summary of category scores (Lighthouse CI: filesystem target). This script turns it into a Markdown table and optionally compares it with a baseline from the main branch.
// scripts/lh-summary.mjs  -  node scripts/lh-summary.mjs lhci [baseline.json]
import { readFileSync, writeFileSync } from 'node:fs';
import { join } from 'node:path';

const [dir = 'lhci', baseFile] = process.argv.slice(2);
const manifest = JSON.parse(readFileSync(join(dir, 'manifest.json'), 'utf8'));
const base = baseFile ? JSON.parse(readFileSync(baseFile, 'utf8')) : {};
const METRICS = {
  'largest-contentful-paint': ['LCP', 'ms'],
  'total-blocking-time': ['TBT', 'ms'],
  'cumulative-layout-shift': ['CLS', ''],
};

const rows = [], current = {};
for (const entry of manifest.filter(e => e.isRepresentativeRun)) {
  const lhr = JSON.parse(readFileSync(entry.jsonPath, 'utf8'));
  if (lhr.runtimeError) { rows.push(`| ${entry.url} | error: ${lhr.runtimeError.code} | | | |`); continue; }
  const path = new URL(entry.url).pathname;
  const perf = Math.round(lhr.categories.performance.score * 100);
  const m = Object.fromEntries(Object.keys(METRICS).map(id => [id, lhr.audits[id]?.numericValue ?? null]));
  current[path] = { perf, ...m };

  const delta = (now, was, digits = 0) =>
    was == null ? '' : ` (${now - was >= 0 ? '+' : ''}${(now - was).toFixed(digits)})`;
  const b = base[path] || {};
  const cells = Object.entries(METRICS).map(([id, [, unit]]) => {
    const d = unit ? 0 : 3;
    return m[id] == null ? 'n/a' : `${m[id].toFixed(d)}${unit}${delta(m[id], b[id], d)}`;
  });
  rows.push(`| ${path} | ${perf}${delta(perf, b.perf)} | ${cells.join(' | ')} |`);
}

const md = [
  '### Lighthouse CI (median of runs)',
  '| Page | Performance | LCP | TBT | CLS |',
  '|---|---|---|---|---|',
  ...rows,
].join('n');
writeFileSync('lh-summary.md', md + 'n');
writeFileSync('lh-current.json', JSON.stringify(current, null, 2));
console.log(md);
Step 5: Lighthouse CI in GitHub Actions
The workflow builds the site, runs Lighthouse CI, writes the summary to the job page, comments on the pull request and keeps the reports as an artifact. GitHub-hosted Ubuntu runners include Chrome.
# .github/workflows/lighthouse.yml
name: Lighthouse CI
on:
  pull_request:
  push:
    branches: [main]

permissions:
  contents: read
  pull-requests: write

jobs:
  lighthouse:
    runs-on: ubuntu-latest
    steps:
      - uses: actions/checkout@v7
      - uses: actions/setup-node@v7
        with:
          node-version: 24
          cache: npm
      - run: npm ci && npm run build

      - name: Run Lighthouse CI
        id: lhci
        continue-on-error: true          # report first, fail at the end
        run: npx --yes @lhci/cli@0.16.x autorun

      - name: Summarise
        if: always()
        run: |
          node scripts/lh-summary.mjs lhci
          cat lh-summary.md >> "$GITHUB_STEP_SUMMARY"

      - name: Comment on the pull request
        if: always() && github.event_name == 'pull_request'
        env:
          GH_TOKEN: ${{ github.token }}
        run: gh pr comment ${{ github.event.pull_request.number }} --body-file lh-summary.md

      - uses: actions/upload-artifact@v7
        if: always()
        with:
          name: lighthouse-reports
          path: lhci/

      - name: Fail if assertions failed
        if: steps.lhci.outcome == 'failure'
        run: exit 1
To show deltas, save lh-current.json as an artifact on pushes to main, download it in pull request runs, and pass it as the second argument to the script. Pull requests from forks get a read-only token, so the comment step will not post there; the job summary still works.
If you also enforce JavaScript size limits, run this job next to the checks in the bundle size budget guide: size budgets catch growth early, Lighthouse catches the effect on rendering.
Keep Lighthouse CI results stable
- Run several times. Three runs per URL is the default in Lighthouse CI; five is better for pages near a threshold.
- Pin the Lighthouse CI version so a new Lighthouse release does not change scores in the middle of a review. Upgrade deliberately and reset baselines.
- Test a production build served locally, without analytics or third-party scripts you cannot control.
- Watch
runWarnings. Warnings about the page being slow to load or redirected often explain a strange score. - Keep lab and field separate. Lighthouse is a lab test on simulated conditions. Real-user data in Search Console or the Chrome UX Report decides how users experience the page, as covered in the WordPress Core Web Vitals guide.
Lighthouse CI checklist
- Lighthouse CI pinned and run on every pull request against a local production build.
- Three or more runs per URL, judged by the median run.
- Budgets on LCP, TBT and CLS values, plus category score floors.
- Reports written to the filesystem and kept as an artifact.
- A summary in the job page and on the pull request, with deltas against
main. - Runtime errors and run warnings checked before trusting a number.
Want this done on your own server or site?
I am Saizul Amin, a web developer and technical SEO consultant. I set up and harden VPS servers, migrate WordPress sites, fix indexing problems and build automations. See my portfolio or get in touch.
FAQ
What is Lighthouse CI?
Lighthouse CI is a set of tools from the Chrome team that runs Lighthouse in continuous integration. It collects several runs per URL, asserts results against budgets you define, and uploads reports to the filesystem, temporary public storage or your own Lighthouse CI server.
Where are the scores in a Lighthouse JSON report?
Category scores are at categories.performance.score and similar paths, as numbers from 0 to 1. Individual audits are under audits, keyed by ID, with a score, a numericValue for metrics, a displayValue and details.
Why do Lighthouse scores change between runs?
Network timing, CPU load on the machine, third-party scripts and server response times all vary. Run Lighthouse several times, use the median run, test a local production build and set budgets on metrics instead of relying on one score.
Should Lighthouse CI fail the build?
Yes for clear budgets on a stable setup, such as LCP, Total Blocking Time and CLS on the median run. Start with warnings, watch the results for a week or two, then turn the stable ones into errors.
Is Lighthouse the same as Core Web Vitals?
No. Lighthouse is a lab test under simulated conditions. Core Web Vitals in Search Console come from real Chrome users. Use Lighthouse to catch regressions before release and field data to judge real experience.
Sources
- Lighthouse CI: Getting started
- Lighthouse CI: Configuration
- Lighthouse: Understanding the results (JSON report)
- Chrome for Developers: Lighthouse performance scoring
- Chrome for Developers: Lighthouse overview

Saizul Amin is an AI agent developer, AI automation engineer and full-stack software developer from Dhaka, Bangladesh. He builds any kind of AI agent, AI automation and custom software for any business. Portfolio: https://saizul.com