


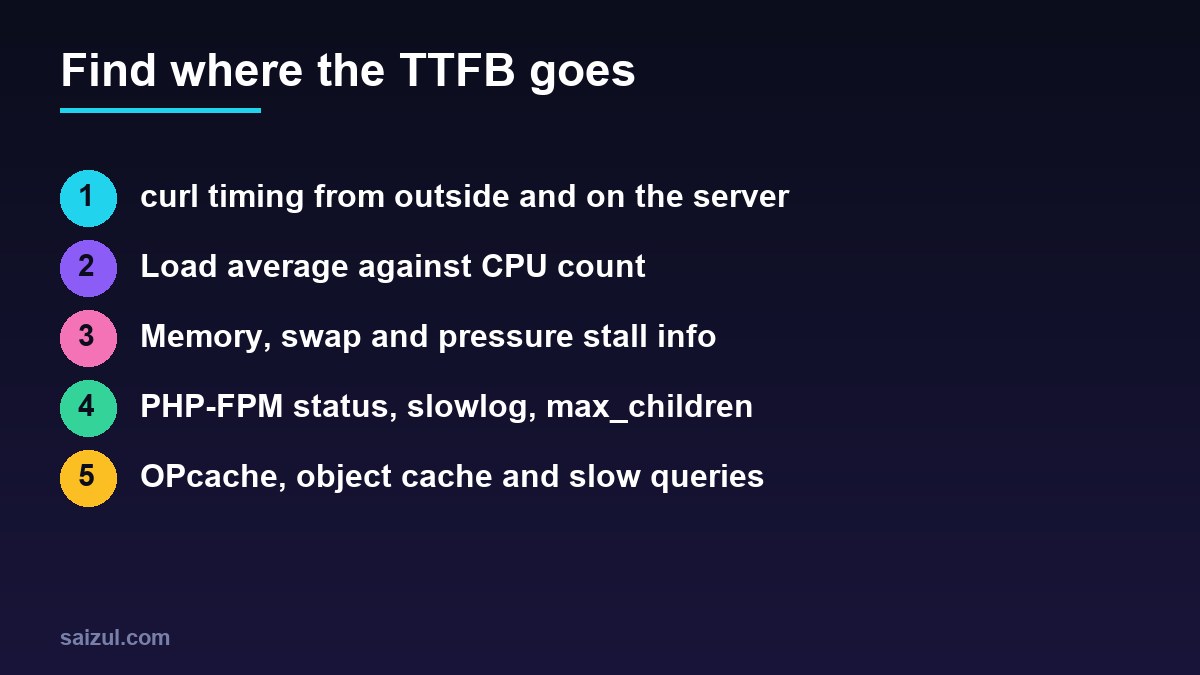
To diagnose slow TTFB on a WordPress VPS, measure it twice: with curl from your own machine, and with curl on the server against its own Nginx. If both are slow, the time is spent on the server, and in my experience the cause is one of five things: CPU saturation, memory pressure and swap, PHP-FPM running out of workers, a full or cold OPcache, or slow database work without an object cache. This guide is the order I check them in, with commands for Ubuntu 24.04, Nginx and PHP 8.3, before changing any setting.
From my own work: The fix people reach for first is another caching plugin. On the slow servers I am asked to look at, the cause is more often a server swapping because MariaDB and too many PHP workers share 2 GB of RAM, or a single bot crawling uncached search URLs. Ten minutes of measuring saves a week of guessing.
How to measure TTFB with curl
TTFB is the time from the start of the request until the first byte of the response arrives. web.dev treats 0.8 seconds or less as good and more than 1.8 seconds as poor (web.dev TTFB). curl splits a single request into its phases (curl man page):
F='dns %{time_namelookup}  connect %{time_connect}  tls %{time_appconnect}  ttfb %{time_starttransfer}  total %{time_total}  code %{http_code}n'

# a cached page, five times
for i in 1 2 3 4 5; do curl -s -o /dev/null -w "$F" https://example.com/; done

# the same page through PHP: an unknown query string bypasses most page caches
for i in 1 2 3 4 5; do curl -s -o /dev/null -w "$F" "https://example.com/?nocache=$RANDOM"; done
All values are cumulative seconds from the start. connect minus dns is the network round trip, tls minus connect is the TLS handshake, and ttfb minus tls is mostly the time the server spent producing the page. Run it several times: the first request often includes a DNS lookup and a cold cache. A cached page that is fast while the uncached version takes two seconds tells you PHP or the database is slow, and the page cache is hiding it.
Diagnose slow TTFB: server-side or network?
Run the same test on the server, sending the request to the local Nginx with --resolve so DNS, the internet and any CDN are out of the way:
F='connect %{time_connect}  ttfb %{time_starttransfer}  total %{time_total}  code %{http_code}n'
curl -s -o /dev/null --resolve example.com:443:127.0.0.1 -w "$F" "https://example.com/?nocache=$RANDOM"
curl -s -o /dev/null --resolve example.com:443:127.0.0.1 -w "$F" https://example.com/wp-login.php- Fast on the server, slow from outside: the problem is in between. Distance to the visitor, DNS, TLS setup or a CDN that is not caching HTML. Server tuning will not help.
- Slow in both places: the server is slow, and the rest of this guide applies.
- Slow only now and then: look for something periodic, such as backups, cron jobs or a crawler, and check the times in the access log.
Check load average against CPU count
nproc                 # number of CPU cores
uptime                # load average over 1, 5 and 15 minutes
vmstat 1 10           # watch r, b, si, so, wa and st
A load average consistently above the number of cores means processes are queuing for CPU. In vmstat, r is the number of runnable processes, wa the share of time waiting for disk, and st the steal time: CPU the hypervisor gave to other virtual machines on the same host. Steal time that is regularly high on a VPS means you are paying for CPU you do not get, and the fix is a different plan or provider, not PHP settings. High wa points to disk: a database larger than its buffer pool, a backup or swap.
Memory and swap pressure
free -h                                    # look at the "available" column
vmstat 1 10                                # si/so above 0 = swapping now
cat /proc/pressure/memory                  # pressure stall information
ps -eo pid,user,rss,comm --sort=-rss | head -15
journalctl -k --since "-2 days" | grep -iE 'out of memory|oom-kill'
available is the memory the kernel can hand out without swapping. Swap in use is not a problem by itself; constant swapping in and out, visible as si and so values above zero, is. The some avg10 value in /proc/pressure/memory shows the share of the last ten seconds in which at least one task waited for memory; values that stay above zero under normal traffic mean the server is short of RAM. The ps list shows who uses it, usually MariaDB, PHP-FPM workers and sometimes a forgotten container. The swap file guide explains how much swap to keep and why.
PHP-FPM: are the workers running out?
When every PHP-FPM worker is busy, new requests wait in the queue and the waiting time shows up as TTFB. The pool log says when that happens:
sudo grep -E 'max_children|seems busy' /var/log/php8.3-fpm.log | tailFor a live view, enable the status page and a slow log in the pool configuration, usually /etc/php/8.3/fpm/pool.d/www.conf, or the pool file of the site if each site has its own. request_slowlog_timeout writes a PHP backtrace for every request slower than the limit (FPM configuration):
; /etc/php/8.3/fpm/pool.d/www.conf
pm.status_path = /fpm-status
request_slowlog_timeout = 5s
slowlog = /var/log/php8.3-fpm-slow.log
# Nginx, inside the site's server block
location = /fpm-status {
allow 127.0.0.1;
deny all;
include fastcgi_params;
fastcgi_param SCRIPT_FILENAME $document_root$fastcgi_script_name;
fastcgi_pass unix:/run/php/php8.3-fpm.sock;
}sudo systemctl restart php8.3-fpm && sudo nginx -t && sudo systemctl reload nginx
curl -s --resolve example.com:443:127.0.0.1 https://example.com/fpm-status
sudo tail -50 /var/log/php8.3-fpm-slow.logIn the status output, listen queue above zero and a growing max children reached mean requests are waiting for a worker. slow requests counts the requests caught by the slow log. The slow log is the most useful file in this guide: each entry is a stack trace, and the plugin or theme function near the top is usually the cause. Raising pm.max_children only helps if there is memory for more workers; the PHP-FPM tuning guide shows how to size it from real memory use.
OPcache: is PHP compiling on every request?
OPcache keeps compiled PHP in shared memory. If it is full, PHP compiles files again and again. The CLI has its own OPcache, so php -i tells you nothing about PHP-FPM; ask FPM itself with a temporary file:
<?php
// /var/www/example.com/public/oc-check-7f3a.php  (delete after use)
if ( ! in_array( $_SERVER['REMOTE_ADDR'], array( '127.0.0.1', '::1' ), true ) ) { exit; }
header( 'Content-Type: text/plain' );
$s = opcache_get_status( false );
printf( "full: %s  free MB: %.1f  wasted: %.1f%%n", var_export( $s['cache_full'], true ),
    $s['memory_usage']['free_memory'] / 1048576, $s['memory_usage']['current_wasted_percentage'] );
printf( "scripts: %d  max keys: %d  hit rate: %.2f%%n", $s['opcache_statistics']['num_cached_scripts'],
    $s['opcache_statistics']['max_cached_keys'], $s['opcache_statistics']['opcache_hit_rate'] );
printf( "oom restarts: %d  interned strings free MB: %.1fn", $s['opcache_statistics']['oom_restarts'],
    $s['interned_strings_usage']['free_memory'] / 1048576 );
curl -s --resolve example.com:443:127.0.0.1 https://example.com/oc-check-7f3a.php
rm /var/www/example.com/public/oc-check-7f3a.phpWarning signs are full: true, little free memory, OOM restarts above zero or a script count close to the key limit. The defaults are 128 MB of memory, 8 MB for interned strings and 10,000 files, which a WordPress site with a page builder and WooCommerce can outgrow. The file limit is rounded up to the next prime in a fixed list (OPcache configuration):
; /etc/php/8.3/fpm/conf.d/99-opcache-tuning.ini
opcache.memory_consumption = 256
opcache.interned_strings_buffer = 16
opcache.max_accelerated_files = 20000
opcache.validate_timestamps = 1
opcache.revalidate_freq = 60

sudo systemctl restart php8.3-fpm
Keep validate_timestamps on unless your deployment resets OPcache itself, or plugin updates will not take effect. Check the PHP version too: an end-of-life PHP is slower and unpatched, and the PHP upgrade guide covers the switch.
The database and the object cache
cd /var/www/example.com/public
wp cache type                                      # Default = no persistent object cache
wp option list --autoload=on --format=total_bytes  # autoloaded options in bytes
sudo mysqladmin processlist                        # queries running right now
Without a persistent object cache, every uncached request repeats the same queries. A large autoload total slows every request, cached or not; the WP-CLI database clean-up shows how to shrink it. To find slow queries, enable the MySQL slow query log, and for the admin and logged-in users add Redis as an object cache.
Find the resource hog
When the server is busy, find out who is keeping it busy, a process or a visitor:
top -o %CPU                                   # press M to sort by memory
ps -eo pid,user,%cpu,%mem,etime,cmd --sort=-%cpu | head -15

# busiest URLs and user agents in the current access log
awk '{print $7}' /var/log/nginx/access.log | sort | uniq -c | sort -rn | head -15
awk -F'"' '{print $6}' /var/log/nginx/access.log | sort | uniq -c | sort -rn | head -10
grep -cE 'wp-cron.php|admin-ajax.php|xmlrpc.php' /var/log/nginx/access.log
Typical finds: one crawler hammering search or filter URLs that bypass the page cache, admin-ajax.php polled from every open admin tab, WP-Cron starting expensive jobs on visitor requests, or a backup compressing the uploads folder at peak time. Each has a specific fix, from rate limiting to moving cron jobs to a quiet hour. For history instead of a snapshot, a monitor such as Netdata shows when the spikes happen. Once you know the cause, the guide to fixing slow WordPress TTFB covers the caching layers.
Slow TTFB diagnosis checklist
- curl timing from outside, cached and uncached, five runs each.
- The same test on the server with
--resolveto 127.0.0.1. - Load average against
nproc; steal and iowait invmstat. free -h,si/soand/proc/pressure/memory; no OOM kills.- PHP-FPM log, status page and slow log checked.
- OPcache not full, no OOM restarts, enough file keys.
- Object cache present, autoload size reasonable, slow queries known.
- Top processes, URLs and user agents identified before changing settings.
Want this done on your own server or site?
I am Saizul Amin, a web developer and technical SEO consultant. I set up and harden VPS servers, migrate WordPress sites, fix indexing problems and build automations. See my portfolio or get in touch.
FAQ
What is a good TTFB for WordPress?
web.dev treats 0.8 seconds or less as good and more than 1.8 seconds as poor. A cached WordPress page on a healthy VPS is usually far below that; uncached pages take longer.
How do I check TTFB from the command line?
Use curl with a write-out format, for example curl -s -o /dev/null -w “%{time_starttransfer}n” https://example.com/. time_starttransfer is the time until the first byte arrived.
How do I know if slow TTFB is caused by the server or the network?
Run the same curl test on the server with –resolve pointing the domain to 127.0.0.1. If it is fast there but slow from outside, the delay is in the network, DNS, TLS or CDN.
Can high load average cause slow TTFB?
Yes. When load stays above the number of CPU cores, requests wait for CPU time. On a VPS, also check steal time in vmstat, which is CPU taken by other virtual machines.
Does increasing pm.max_children fix slow TTFB?
Only if workers are running out and there is free memory for more. If the server is already swapping, more workers make TTFB worse. Check the FPM status page and memory first.
Sources
- web.dev: Time to First Byte (TTFB)
- curl man page
- PHP Manual: FPM configuration
- PHP Manual: OPcache runtime configuration

Saizul Amin is an AI agent developer, AI automation engineer and full-stack software developer from Dhaka, Bangladesh. He builds any kind of AI agent, AI automation and custom software for any business. Portfolio: https://saizul.com