

Most WordPress VPS owners find out about a problem from a visitor: the site is slow, the checkout times out, the disk is full. Monitoring turns that around, and on a single server it does not need a Prometheus stack. Netdata collects thousands of metrics every second with almost no configuration, ships with sensible alerts and shows everything on a local dashboard. This guide installs it on Ubuntu 24.04, keeps the dashboard off the public internet, limits its disk use, connects Nginx, PHP-FPM and MariaDB, and sends alerts somewhere you will see them.
From my own work: On my own servers Netdata listens on localhost only and I open it through an SSH tunnel when I need it. The alerts that have actually saved sites were boring ones: disk space running out because of a log or backup folder, PHP-FPM reaching its worker limit during a sale, and swap filling up after a plugin update.
Why Netdata on a single server
Netdata runs as one agent per server. It detects running services and starts collecting from them, keeps the data in its own database on disk, and evaluates alerts locally, so it keeps working if the server cannot reach the internet. Per-second resolution is the difference that matters for WordPress: a ten-second CPU spike from a cron job or a crawler is invisible in five-minute averages and obvious in Netdata. Netdata Cloud is optional; everything in this guide works with the agent alone.
Install the agent
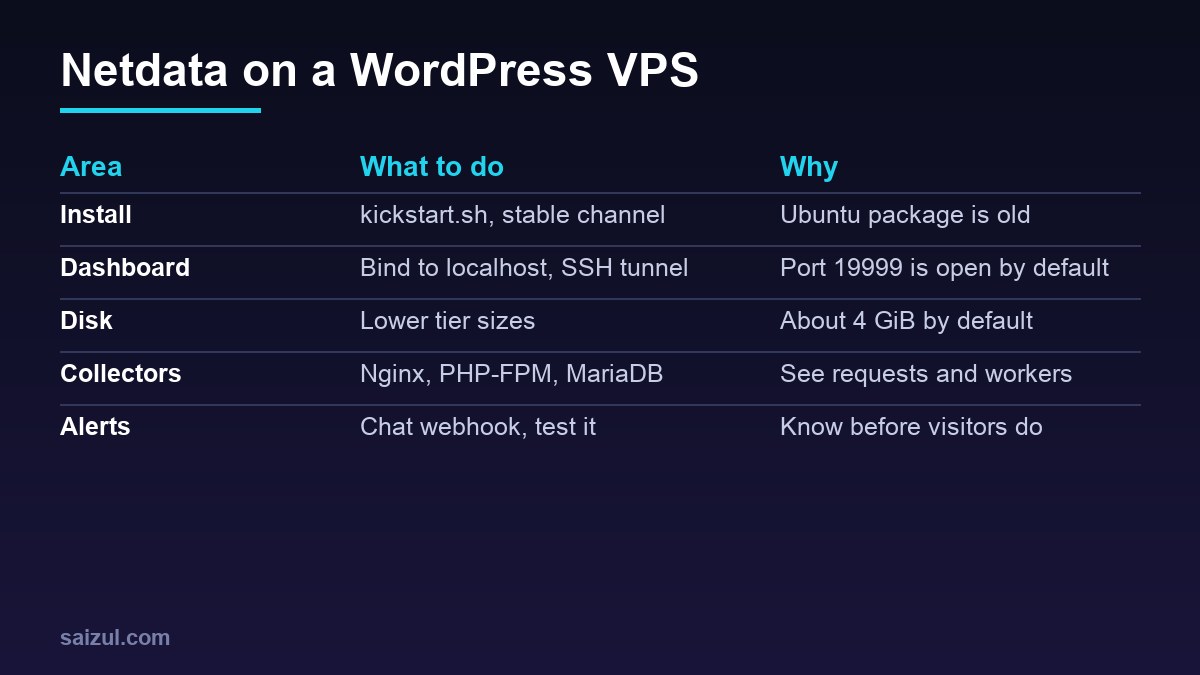
Ubuntu 24.04 has a netdata package, but it is version 1.43 from 2023. Netdata recommends its kickstart.sh script, which installs native packages from Netdata’s own repository where it can and sets up automatic updates (Netdata installation). Download it first, so you can read it before running it as root:
wget -O /tmp/netdata-kickstart.sh https://get.netdata.cloud/kickstart.sh
less /tmp/netdata-kickstart.sh
sh /tmp/netdata-kickstart.sh --release-channel stable --disable-telemetry

systemctl status netdata --no-pager
curl -s -o /dev/null -w '%{http_code}n' http://127.0.0.1:19999/
The default channel is nightly; stable is the better choice for a production server. --disable-telemetry opts out of anonymous usage statistics. Without a claim token the node is not connected to Netdata Cloud, which you can do later. Kickstart enables daily automatic updates by default; keep them, or pass --no-updates and update deliberately.
Keep port 19999 private
Out of the box the dashboard listens on port 19999 on every interface. On a VPS with a public IP, that means anyone can read your server’s metrics, process names and service details (Securing Netdata Agents). Bind it to localhost:
cd /etc/netdata
sudo ./edit-config netdata.conf

[web]
    bind to = localhost:19999

sudo systemctl restart netdata
ss -tlnp | grep 19999          # should show 127.0.0.1 and ::1 only

# from your own computer
ssh -L 19999:localhost:19999 you@your-server
# then open http://localhost:19999
edit-config copies the stock file into /etc/netdata before you change it, so updates do not overwrite your edits. The SSH tunnel uses the access you already have, with no extra password or port. If several people need the dashboard, put it behind Nginx with TLS and Basic Auth on a subdomain instead. A firewall rule alone also works, as in UFW on an Ubuntu VPS, but binding to localhost cannot be undone by a mistaken rule later.
Retention and disk use
Netdata stores metrics in three tiers, per second, per minute and per hour, each limited to 1 GiB by default, with time limits of 14 days, 3 months and 2 years. With its own metadata, Netdata says to expect about 4 GiB of disk use (Disk and retention). On a 25 GB VPS that is a lot. Lower the sizes in netdata.conf:
[db]
    dbengine tier 0 retention size = 256MiB
    dbengine tier 0 retention time = 7d
    dbengine tier 1 retention size = 256MiB
    dbengine tier 2 retention size = 256MiB
Restart the service after the change. A week of per-second data and months of per-minute data are plenty for a single WordPress server. If RAM is tight as well, add a swap file before you add monitoring.
Nginx: the stub_status page
The Nginx collector reads the standard status page and finds it automatically on http://127.0.0.1/stub_status and a few similar addresses. Ubuntu’s Nginx includes the module; add a server that only answers on localhost:
# /etc/nginx/conf.d/stub_status.conf
server {
    listen 127.0.0.1:80;
    server_name 127.0.0.1;
    location = /stub_status {
        stub_status;
        allow 127.0.0.1;
        deny all;
    }
}

sudo nginx -t && sudo systemctl reload nginx
curl -s http://127.0.0.1/stub_status
Netdata picks it up within a minute and shows active connections and requests per second. For response codes and slow URLs, the web log collector reads the Nginx access log as well; it needs read access to /var/log/nginx, which the adm group has on Ubuntu; add the netdata user to that group if the collector reports a permission error.
PHP-FPM: workers and the slow queue
Enable the status page in the site’s pool and let Netdata talk to the socket directly, so the page is never exposed through Nginx:
# /etc/php/8.3/fpm/pool.d/example.conf
pm.status_path = /status
listen.acl_users = www-data,netdata

sudo php-fpm8.3 -t && sudo systemctl restart php8.3-fpm

# /etc/netdata/go.d/phpfpm.conf  (sudo ./edit-config go.d/phpfpm.conf)
jobs:
  - name: example
    socket: /run/php/php8.3-fpm-example.sock
listen.acl_users gives both Nginx and Netdata access to the socket; when it is set, PHP-FPM ignores listen.owner and listen.group, so list every user that needs it. The chart to watch is active processes against pm.max_children: if it sits at the limit, requests queue and the site feels slow even with idle CPU. Tuning that limit is covered in PHP-FPM tuning for WordPress. On CloudPanel, PHP-FPM listens on a local TCP port instead, so use address: 127.0.0.1:PORT from the site’s vhost.
MariaDB or MySQL
sudo mariadb -e "CREATE USER 'netdata'@'localhost';
  GRANT USAGE, SLAVE MONITOR, PROCESS ON *.* TO 'netdata'@'localhost';"

# MySQL: GRANT USAGE, REPLICATION CLIENT, PROCESS ON *.* TO 'netdata'@'localhost';
The user can read server statistics but no data. Netdata connects through the local socket and shows queries, connections, buffer pool use and slow queries, which pairs well with the slow query log and MariaDB tuning. If a collector shows nothing, run it in debug mode as the netdata user: sudo -u netdata /usr/libexec/netdata/plugins.d/go.d.plugin -d -m mysql.
Alerts that mean something
Netdata ships with alerts for disk space, RAM, swap, CPU, load, network errors and every service it detects. Alert definitions live in health.d/, start with alarm: or template:, and are reloaded without a restart (Alert configuration reference). Change thresholds by copying the stock file with edit-config, or add your own:
# sudo ./edit-config health.d/ram-usage.conf
 alarm: wp_ram_usage
    on: system.ram
lookup: average -1m percentage of used
 units: %
 every: 1m
  warn: $this > 80
  crit: $this > 90
  info: RAM use on the WordPress server

sudo netdatacli reload-health
Notifications go through health_alarm_notify.conf. Email needs a working local mail command, which most VPSs do not have, so a chat webhook is the easier route. For Discord, set SEND_DISCORD="YES", DISCORD_WEBHOOK_URL and DEFAULT_RECIPIENT_DISCORD; Slack and Telegram work the same way. Then send a test as the netdata user:
sudo ./edit-config health_alarm_notify.conf
sudo su -s /bin/bash netdata
/usr/libexec/netdata/plugins.d/alarm-notify.sh test
The test sends a warning, a critical and a clear message. If they do not arrive, the troubleshooting section of the notification docs lists the checks, and /var/log/netdata/error.log shows what the script tried. Netdata watches the server from inside; add an outside check of the site itself too, because a server can look healthy while DNS, the certificate or a firewall rule keeps visitors out. The Certbot guide covers renewal checks.
Want this done on your own server or site?
I am Saizul Amin, a web developer and technical SEO consultant. I set up and harden VPS servers, migrate WordPress sites, fix indexing problems and build automations. See my portfolio or get in touch.
FAQ
Is Netdata free?
The Netdata Agent is free and open source and works on its own, with a local dashboard and alerts. Netdata Cloud adds central dashboards and has free and paid plans; configuring collectors from the UI needs a paid plan, editing files does not.
How do I secure the Netdata dashboard?
Bind it to localhost with bind to = localhost:19999 in the [web] section of netdata.conf and open it through an SSH tunnel, or put it behind Nginx with TLS and authentication.
How much disk does Netdata use?
About 4 GiB with the default retention of 1 GiB per tier. Lower the dbengine tier retention sizes in netdata.conf on small VPS disks.
Sources
- Netdata Learn: Install Netdata with kickstart.sh
- Netdata Learn: Securing Netdata Agents
- Netdata Learn: Disk requirements and retention
- Netdata Learn: Alert configuration reference

Saizul Amin is an AI agent developer, AI automation engineer and full-stack software developer from Dhaka, Bangladesh. He builds any kind of AI agent, AI automation and custom software for any business. Portfolio: https://saizul.com