

Server metrics tell you how a machine is doing from the inside. They do not tell you whether a visitor can load the home page, whether the checkout still shows the payment button, or whether last night’s backup ran at all. That is the job of an uptime monitor, and Uptime Kuma is a good self-hosted one: a single container with a web interface, many monitor types, status pages and notifications to most chat and email services. This guide installs Uptime Kuma 2 with Docker on Ubuntu 24.04, puts it behind Nginx with HTTPS, sets up the monitors that matter for WordPress and VPS work, and uses push monitors to catch cron jobs that silently stop.
From my own work: I run Uptime Kuma on a small separate VPS, never on the servers it watches. The alerts that have paid for it were not full outages: a page that returned 200 but showed a database error, a certificate that stopped renewing, and a backup job that had not reported in for two days. Each was caught by a keyword, certificate or push monitor, not a plain ping.
Where to run it
A monitor on the same server as the sites cannot report that the server is down. Run Uptime Kuma somewhere else: a small VPS with another provider or in another region, or a machine at home or in the office. It needs little memory for a handful of sites, and Docker. For metrics from inside each server, such as CPU, disk and PHP-FPM workers, pair it with an agent like Netdata; the two answer different questions.
Install with Docker Compose
The official image is louislam/uptime-kuma, and the 2 tag follows the current major version. Data lives in /app/data, which must be a local directory or volume. The project warns that the file system needs working POSIX file locks to avoid SQLite corruption, so do not put the data on NFS (Uptime Kuma: How to Install). With Docker installed as in self-hosting n8n with Docker:
mkdir -p /opt/uptime-kuma && cd /opt/uptime-kuma

cat > compose.yaml <<'EOF'
services:
  uptime-kuma:
    image: louislam/uptime-kuma:2
    container_name: uptime-kuma
    restart: unless-stopped
    ports:
      - "127.0.0.1:3001:3001"
    volumes:
      - ./data:/app/data
EOF

docker compose up -d
docker compose logs -f --tail=50
The port is published on 127.0.0.1 only, so the dashboard is not reachable over plain HTTP from the internet; Docker’s published ports bypass UFW, as explained in the UFW firewall guide. Pin the major tag rather than latest, and read the project’s migration notes before moving to a new major version.
Nginx and HTTPS
The dashboard uses WebSockets, so the proxy must pass the Upgrade and Connection headers with proxy_http_version 1.1. Uptime Kuma does not support sub-paths, so give it its own subdomain (Uptime Kuma: Reverse Proxy):
# /etc/nginx/sites-available/status.example.com
server {
    listen 80;
    listen [::]:80;
    server_name status.example.com;

    location / {
        proxy_pass         http://127.0.0.1:3001;
        proxy_http_version 1.1;
        proxy_set_header   Upgrade $http_upgrade;
        proxy_set_header   Connection "upgrade";
        proxy_set_header   Host $host;
        proxy_set_header   X-Real-IP $remote_addr;
        proxy_set_header   X-Forwarded-For $proxy_add_x_forwarded_for;
        proxy_set_header   X-Forwarded-Proto $scheme;
    }
}
sudo ln -s /etc/nginx/sites-available/status.example.com /etc/nginx/sites-enabled/
sudo nginx -t && sudo systemctl reload nginx
sudo certbot --nginx -d status.example.comCertbot adds the HTTPS block and the redirect; the Certbot guide covers renewal. Open the site and create the admin account straight away. Then, under Settings → Reverse Proxy, set Trust Proxy to Yes so logs show real client addresses, and turn on two-factor authentication under Settings → Security. On a server without a public web server, a Cloudflare Tunnel is an alternative to Nginx.
Monitors that catch real problems
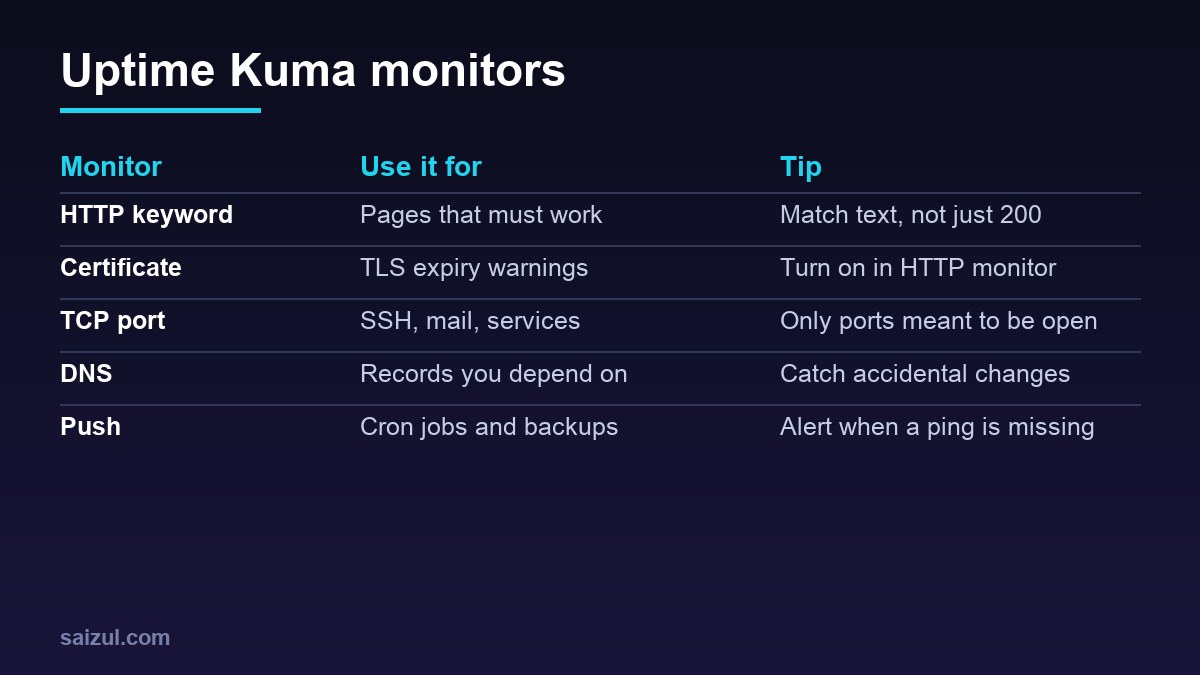
- HTTP(s) with a keyword. A plain HTTP check passes when a page returns 200, even if it shows a database error or an empty page. Choose HTTP(s) – Keyword and match text that only appears when the page works, such as the footer text or the “Add to cart” button.
- Certificate expiry. In the HTTP monitor’s advanced settings, enable the certificate expiry notification, so a renewal that silently fails gives you days of warning.
- TCP port. For services that are meant to be public, such as SSH or a mail server. Never open a database port just to monitor it.
- DNS. Watch the A record or MX record of important domains, so an accidental change at the registrar shows up at once.
- Docker container. Uptime Kuma can check container state on its own host through the Docker socket. Mounting the socket gives the container root-level control of Docker, so only do it if you accept that.
Start with a 60-second interval and two or three retries before a monitor is marked down. That filters out one-off network blips without hiding real outages. For WordPress, monitor the home page, one important inner page such as the checkout or contact form, and /wp-login.php separately: when PHP fails, all three fail; when only the cache layer works, the home page alone can stay up.
Push monitors for cron jobs and backups
Some failures are silent: a backup script stops running, a cron job is removed during a migration, a queue worker dies. A push monitor turns that around. Uptime Kuma gives you a URL, the job calls it when it succeeds, and if no call arrives within the interval the monitor goes down. Create a monitor of type Push, set the heartbeat interval a little longer than the job’s schedule, and copy the URL:
#!/usr/bin/env bash
# end of a nightly backup script
set -euo pipefail
/usr/local/bin/backup-site.sh

curl -fsS -m 10 --retry 3
  "https://status.example.com/api/push/PUSH_TOKEN?status=up&msg=OK&ping=" >/dev/null
Because of set -e, the push only happens if the backup succeeded. For a daily job, an interval of about 25 hours tolerates small delays. This pairs well with the jobs in offsite backups with rclone and the timers in systemd timers vs cron, and the same pattern works for a WordPress cron runner as in replacing WP-Cron.
Notifications that get read
Add a notification under Settings → Notifications: email over SMTP, Telegram, Slack, Discord, Microsoft Teams, a generic webhook and many more are supported. Press Test before you save; a notification that has never fired once is not set up. Send alerts to a channel you actually read on your phone, not to a mailbox that also receives newsletters, and mail from the monitor should pass SPF and DKIM as in the SPF, DKIM and DMARC guide. Tag monitors by client or server, and use Maintenance windows during planned work so updates do not page anyone.
Status pages
A status page shows selected monitors on a public or unlisted URL, which is useful for clients who would otherwise email to ask whether something is down. Create it under Status Pages, add only the monitors that make sense to the public, and give it its own domain if you like. Keep internal checks, such as SSH ports and push monitors, off public pages: they describe your infrastructure to anyone who looks.
Back up and update
cd /opt/uptime-kuma
docker compose stop
tar czf ~/uptime-kuma-$(date +%F).tar.gz data
docker compose pull && docker compose up -d
Stopping the container first gives a consistent copy of the database. Uptime Kuma also has a built-in check for new versions in its settings. Keep the host itself patched with unattended-upgrades; a monitoring server that falls over is worse than none, because it gives you the feeling of being covered.
Want this done on your own server or site?
I am Saizul Amin, a web developer and technical SEO consultant. I set up and harden VPS servers, migrate WordPress sites, fix indexing problems and build automations. See my portfolio or get in touch.
FAQ
Should Uptime Kuma run on the same server as my websites?
No. If that server goes down, the monitor goes down with it and cannot alert you. Run it on a separate small VPS or another machine.
Can Uptime Kuma check that a cron job or backup ran?
Yes, with a push monitor. The job calls the push URL when it succeeds, and the monitor goes down if no call arrives within the heartbeat interval.
Does Uptime Kuma need WebSockets behind Nginx?
Yes. Pass the Upgrade and Connection headers and set proxy_http_version 1.1, and use a subdomain, because sub-paths are not supported.
Sources

Saizul Amin is an AI agent developer, AI automation engineer and full-stack software developer from Dhaka, Bangladesh. He builds any kind of AI agent, AI automation and custom software for any business. Portfolio: https://saizul.com